Tip
Tap
a student's name
below to see what they need help with
111.28.B.11.a Constructing Scatterplots
Quiz by Quizalize - Grade 8 Math
Grade 8
Math (Archived)
Texas Essential Knowledge and Skills (TEKS)
Feel free to use or edit the questions
includes Teacher and Student dashboards
Measures 1 skill from
Grade 8
Math (Archived)
Texas Essential Knowledge and Skills (TEKS)
8.11.A: Measurement and Data
construct a scatterplot and describe the observed data to address questions of association such as linear, non-linear, and no association between bivariate data
Track each student's skills and progress in your Mastery dashboards
10 questions
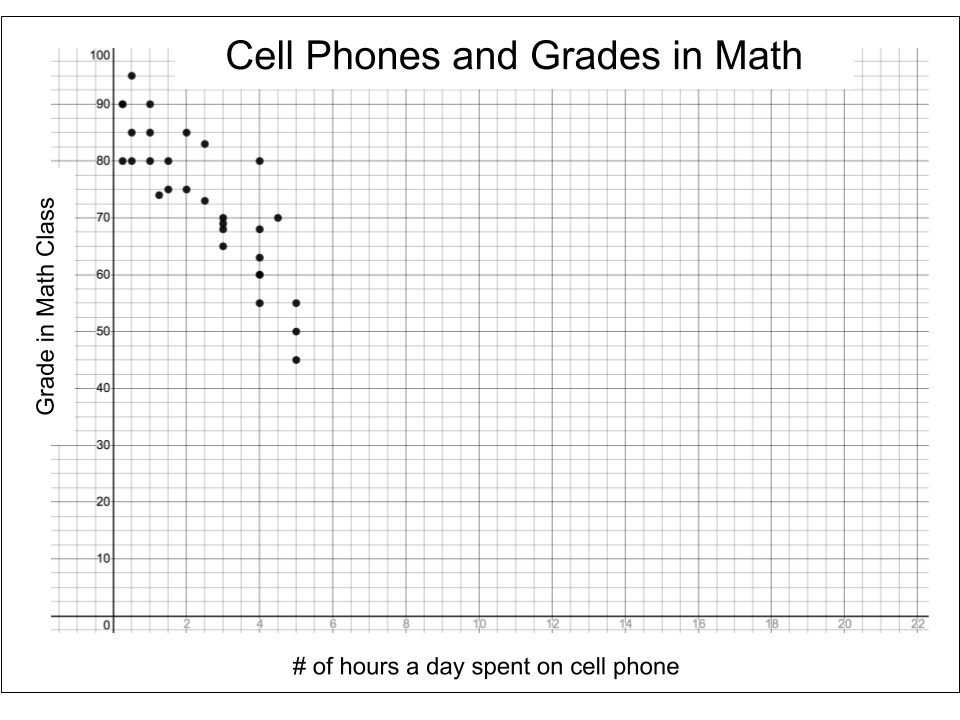
Q.The scatterplot shows students' grades in math class and the number of hours a day spent on their cell phones. Which statement best describes the association between grades and the number of hours spent on a cell phone?
1
120 sec
8.11.A: Measurement and Data
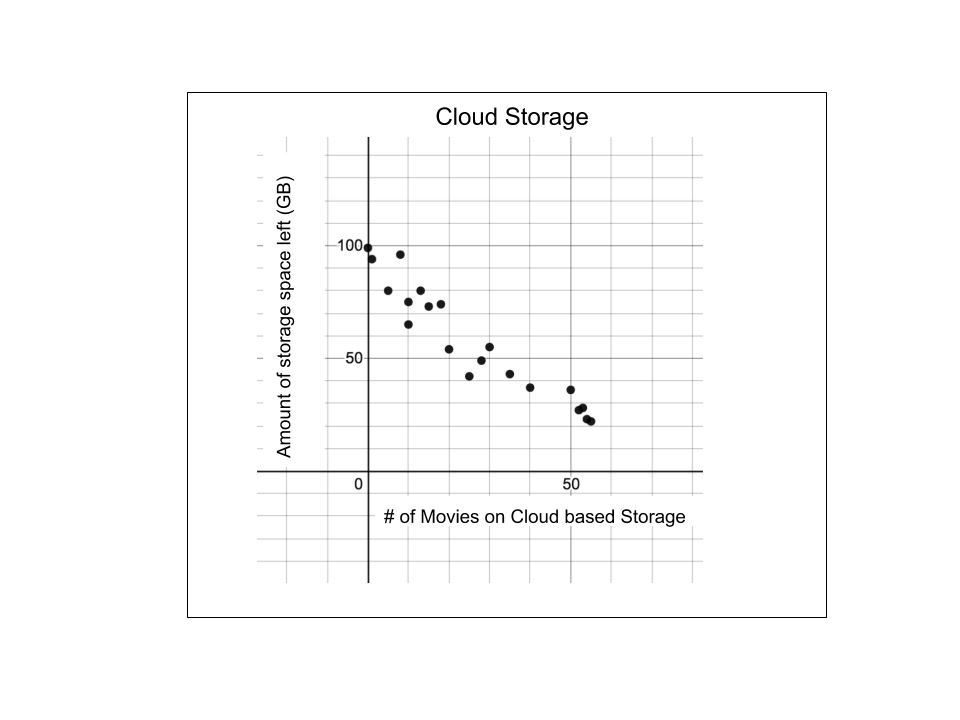
Q.The scatterplot shows the amount of storage space left and the number of movies stored on the Cloud. Which statement best describes the association between the amount of storage space left and the number of movies stored on the Cloud?
2
120 sec
8.11.A: Measurement and Data
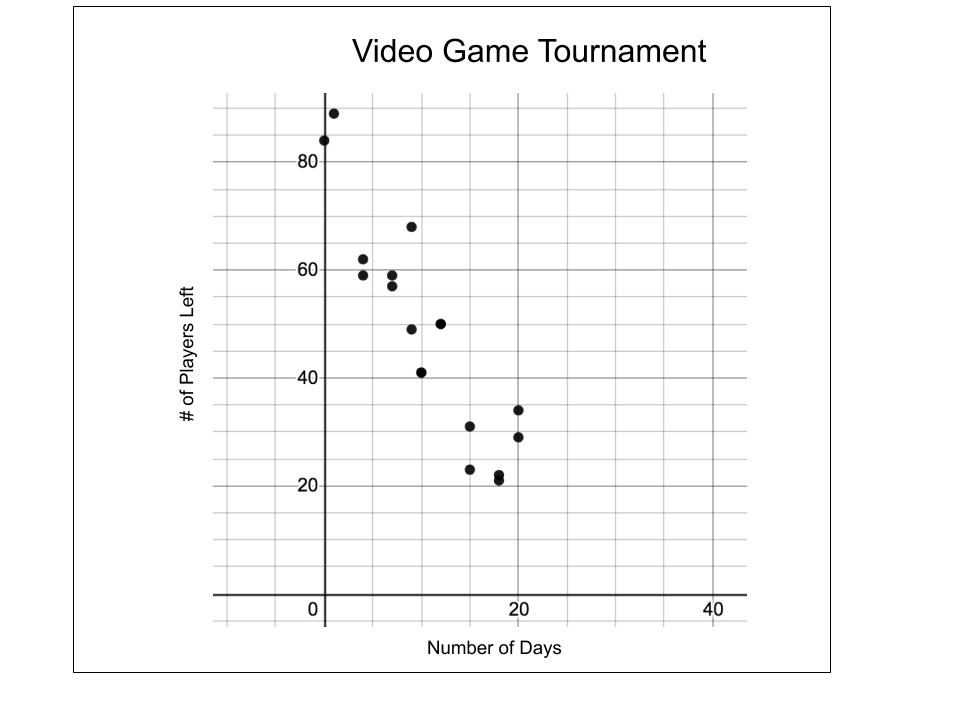
Q.The scatterplot shows the number of players remaining and the number of days that a video game tournament has been running. Which statement best describes the association between the number of players remaining and how long the tournament has been running?
3
120 sec
8.11.A: Measurement and Data
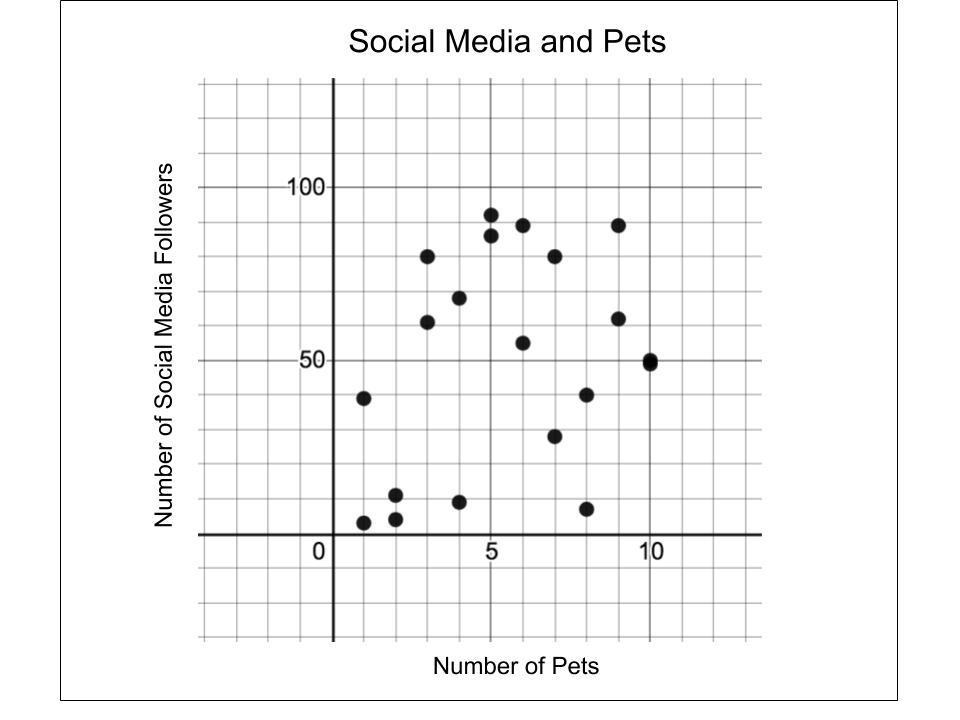
Q.The scatterplot shows the number of social media followers a person has and the number of pets they own. What statement best describes the association between the number of pets people own and social media followers?
4
120 sec
8.11.A: Measurement and Data
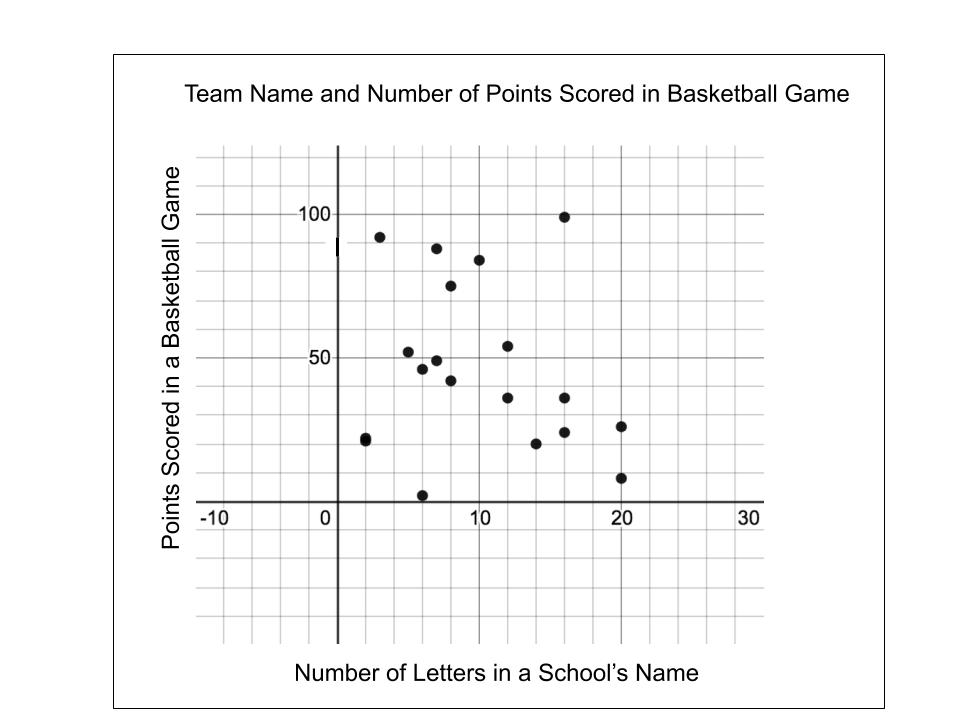
Q.The scatterplot shows the number of points a school scores in a basketball game and the number of letters in the school's name. Which statement best describes the association between the number of letters in a school's name and the number of points they scored in a basketball game?
5
120 sec
8.11.A: Measurement and Data
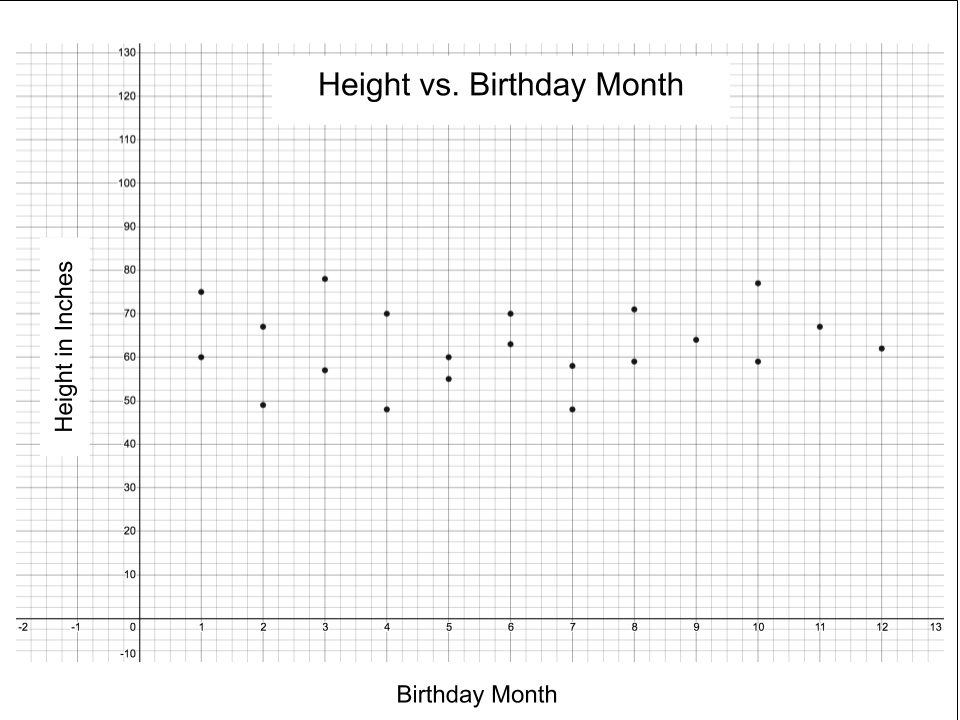
Q.The scatterplot shows the birthday month of a person and their height. Which statement best describes the association between a person’s birthday month and their height?
6
120 sec
8.11.A: Measurement and Data
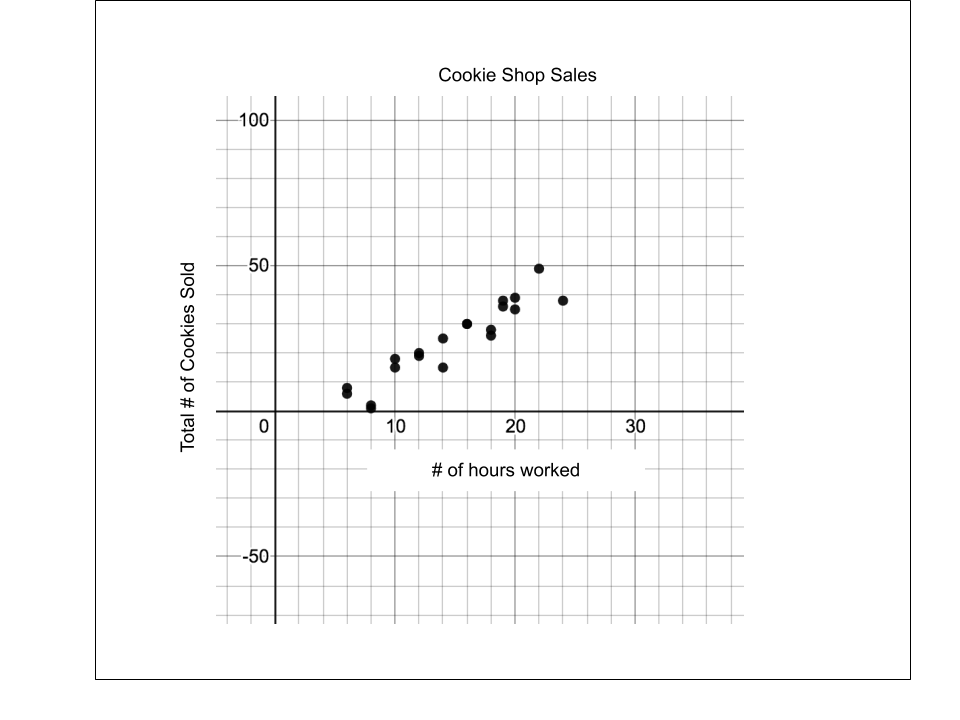
Q.The scatterplot shows the total number of cookies sold and the number of hours worked by employees at a cookie shop over a one week period. Which statement best describes the association between the number of hours worked and the total number of cookies sold?
7
120 sec
8.11.A: Measurement and Data
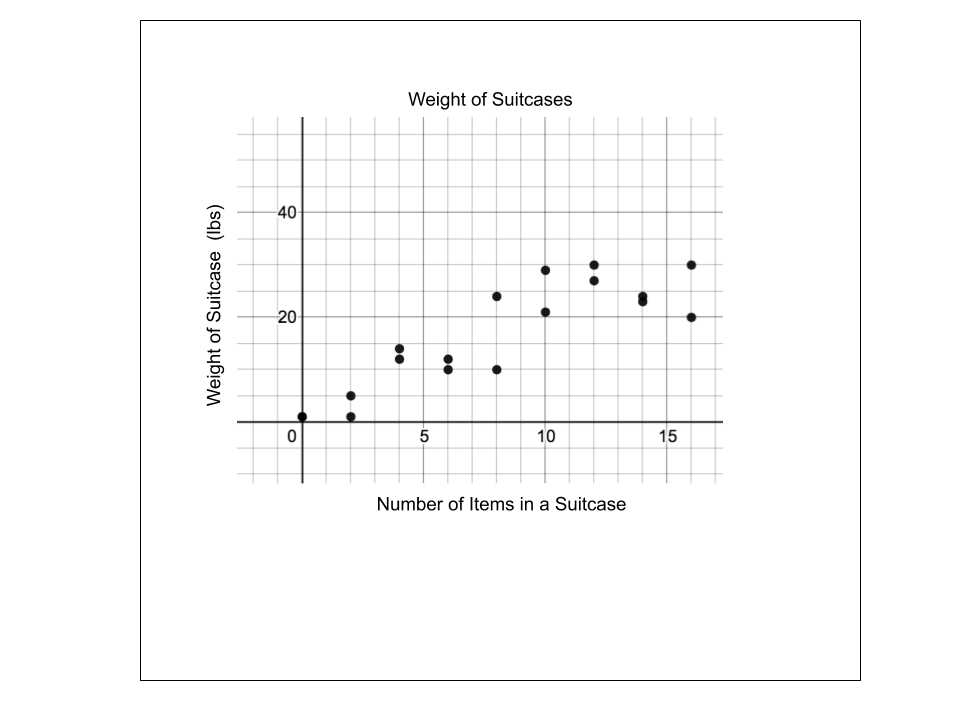
Q.The scatterplot shows the association between the number of items in a suitcase and its weight in pounds. Which statement best describes the association between the number of items in the suitcase and the weight of the suitcase?
8
120 sec
8.11.A: Measurement and Data
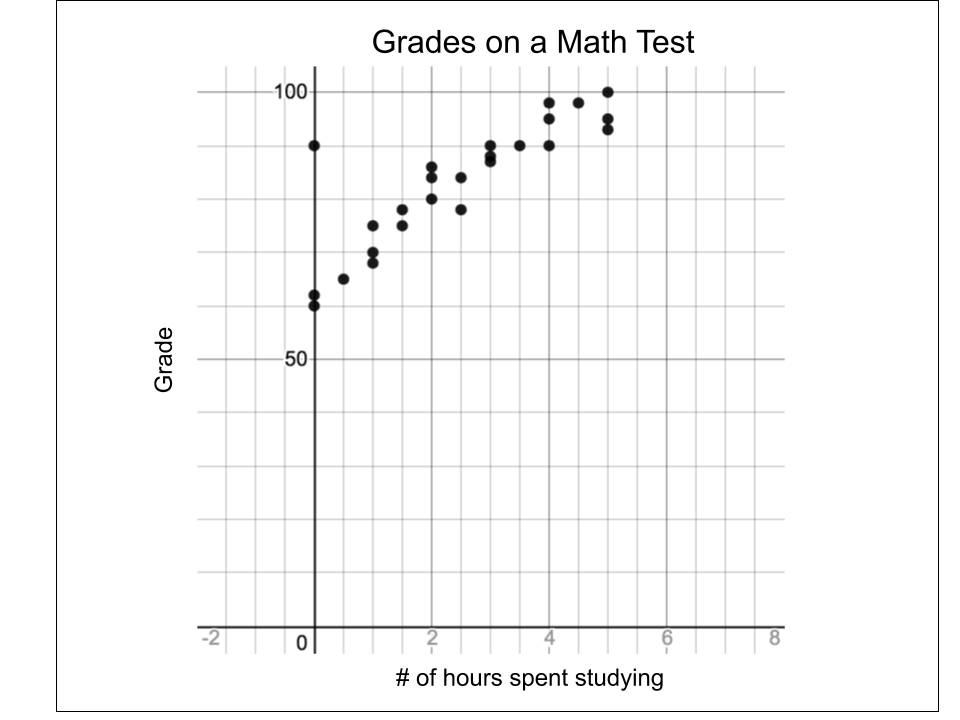
Q.The scatterplot shows the association between the numbers of hours spent studying for a math test and student’s grades on the math test. Which statement best describes the association between the number of hours spent studying and a student’s grade on a math test?
9
120 sec
8.11.A: Measurement and Data
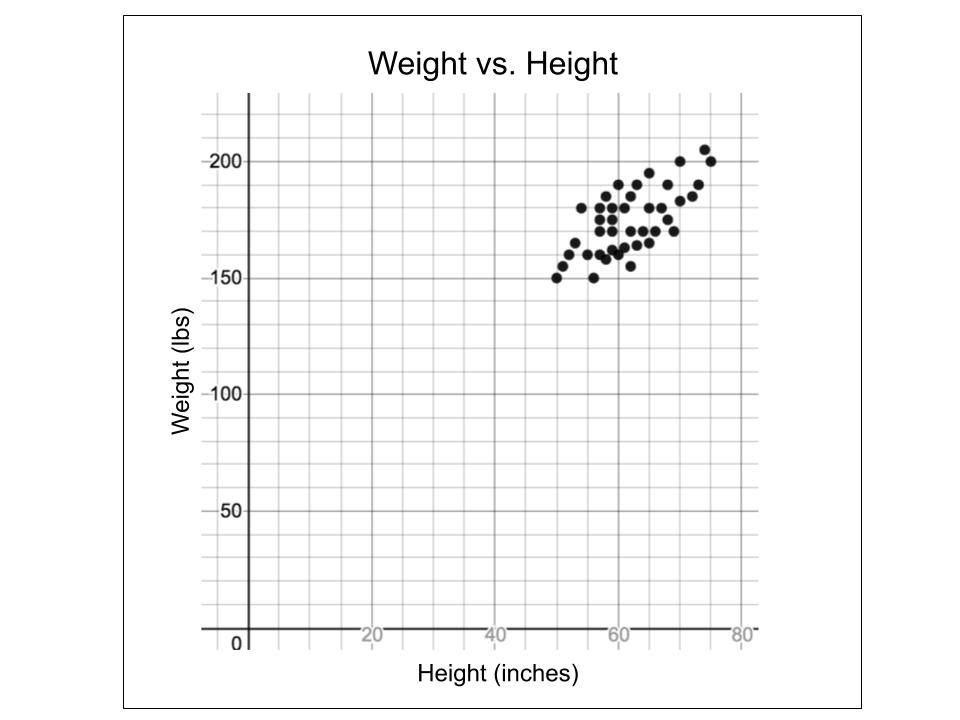
Q.The scatterplot shows the association between a person’s height and a person’s weight. Which statement best describes the relationship between a person’s height and a person’s weight?
10
120 sec
8.11.A: Measurement and Data