Tip
Tap
a student's name
below to see what they need help with
111.28.B.5.d Using Trend Line to predict
Quiz by Quizalize - Grade 8 Math
Grade 8
Math (Archived)
Texas Essential Knowledge and Skills (TEKS)
Customize this quiz to suit your class
Instantly translate to 100+ languages
Measures 1 skill from
Grade 8
Math (Archived)
Texas Essential Knowledge and Skills (TEKS)
8.5.D: Proportionality
use a trend line that approximates the linear relationship between bivariate sets of data to make predictions
Track each student's skills and progress in your Mastery dashboards
10 questions
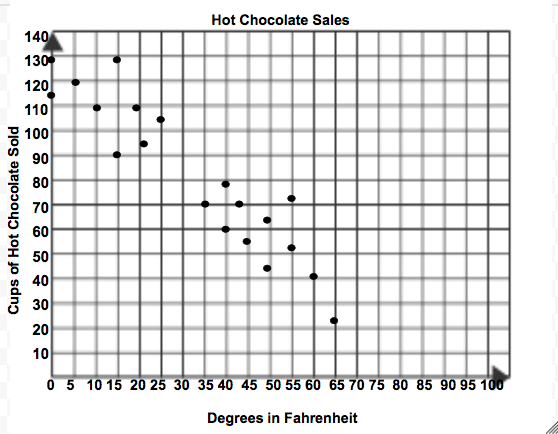
Q.The scatterplot shows the average number of cups of hot chocolate sold and temperature outside. Based on the scatterplot, what is the best prediction of the average number of cups of hot chocolate sold if the temperature outside is around 30 degrees?
1
30 sec
8.5.D: Proportionality
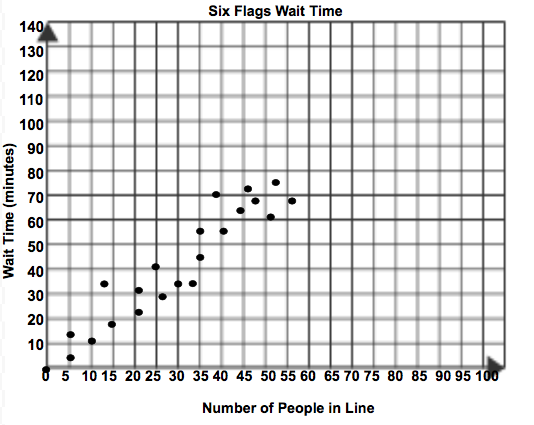
Q.A manager at Six Flags recorded how many people were in line at the rides and how long they had to wait to get on the ride. The scatterplot shows the data they recorded. Based on this scatterplot, about how long will the wait be in there are 90 people in line?
2
30 sec
8.5.D: Proportionality
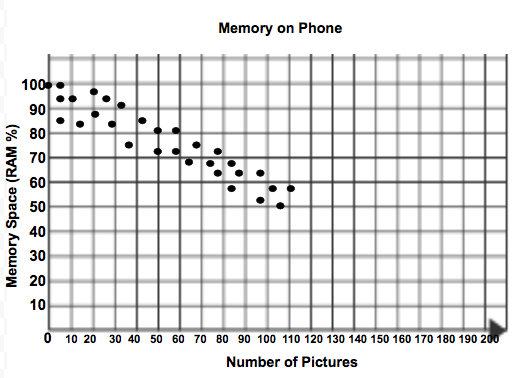
Q.The scatterplot shows the number of pictures that a class has on their phones, and the percentage of RAM left. Based on the scatterplot, what is the best prediction of a person's percent of RAM left on their phone if the person has 180 pictures on their phone?
3
30 sec
8.5.D: Proportionality
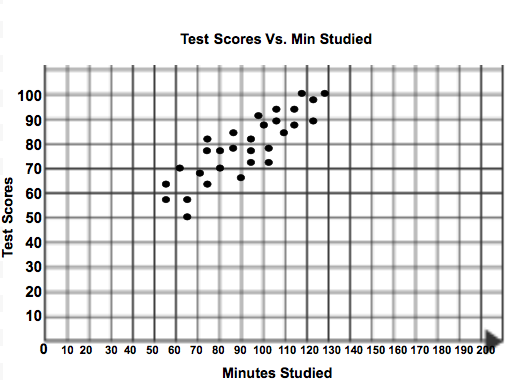
Q.Mrs. Underwood made a scatterplot to show the relationship between the amount of minutes a student studies and the final test scores. Based on the scatterplot, approximately what score should a student that studied for 20 minutes?
4
30 sec
8.5.D: Proportionality
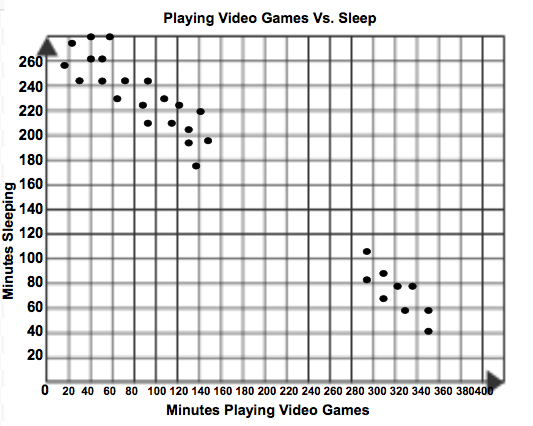
Q.The scatterplot shows the number of minutes 8th graders spend playing video games and the amount of sleep they get in minutes. Based on the scatterplot, what is the best prediction of the minutes playing video games if they got 140 minutes of sleep?
5
30 sec
8.5.D: Proportionality
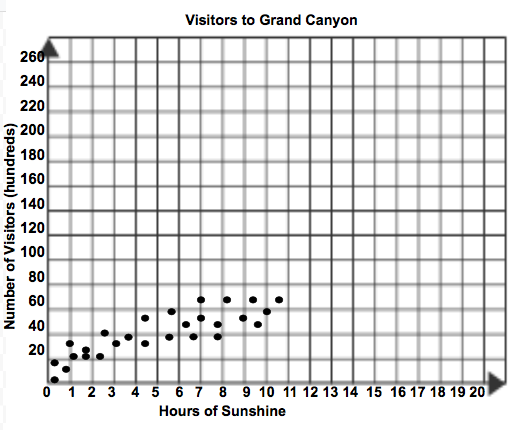
Q.A park ranger for the Grand Canyon kept records of the number of visitors compared to the amount of sunshine for a month. Based on the scatterplot, what is the best prediction of the average number visitors if there was 15 hours of sunshine?
6
30 sec
8.5.D: Proportionality
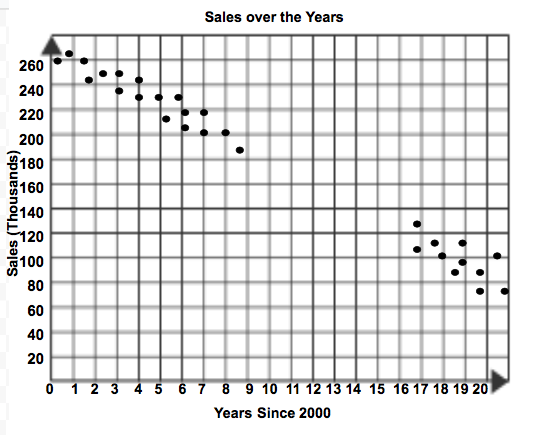
Q.Albert collected the sales records for his company since 2000. He created a scatterplot to show the data he collected. Based on the scatterplot, what is the best prediction of the sales in the year of 2012.
7
30 sec
8.5.D: Proportionality
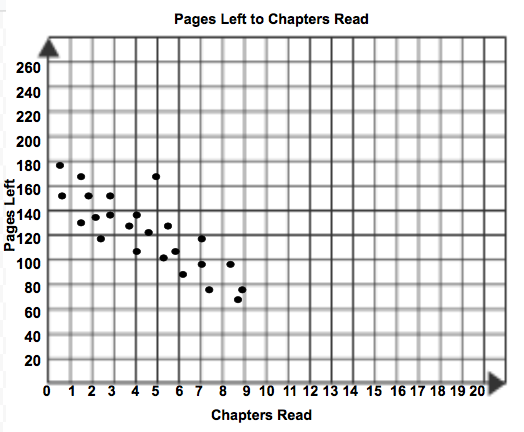
Q.The scatterplot shows the number of pages left in a book compared to the chapters read. Based on the scatterplot, what is the best prediction of the average number of pages left if the person read 11 chapters?
8
30 sec
8.5.D: Proportionality
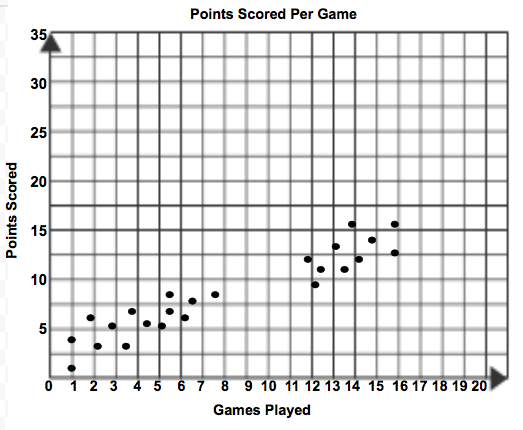
Q.Richard kept track of the amount of points he made compared to the amount of games he played. Based on the scatterplot, how many games had he played to get 10 points?
9
30 sec
8.5.D: Proportionality
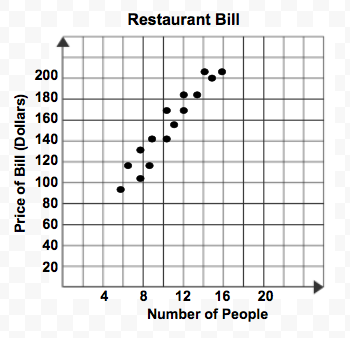
Q.An owner of a restaurant kept track of the number of people at tables in a restaurant and compared them with the amount of their bill. Based on this scatterplot about how much did a party of 4 cost?
10
30 sec
8.5.D: Proportionality