Tip
Tap
a student's name
below to see what they need help with
ALG1 Unit 3 Linear Functions Review
Quiz by Pam McCarthy
Feel free to use or edit the questions
includes Teacher and Student dashboards
Measure skills
from any curriculum
Tag the questions with any skills you have. Your dashboard will track each student's mastery of each skill.


18 questions
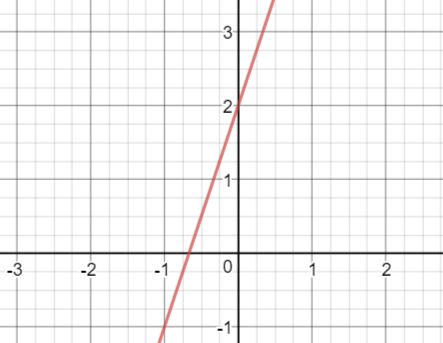
Q.The graph represents the function f(x) = 3x + 2. What change would be seen if f(x) + 4 were graphed?
1
30 sec
Q.Amy is purchasing pizzas. Let x represent the price of pepperoni pizzas and y represent the price of cheese pizzas. She orders 2 pepperoni pizzas and 3 cheese pizzas and the total is $56. Which equation represents the food order.
2
30 sec
Q.Find the slope of the line that connects the following points (-2, -3) and (-10, -9)
3
30 sec
Q.Which function represents the correct SIMPLIFIED explicit function for this sequence? {3, 9, 15, 21, 27, 33, ...}
4
30 sec
Q.Write the following sequence in recursive form. {21, 18, 15, 12, 9, ...}
5
30 sec
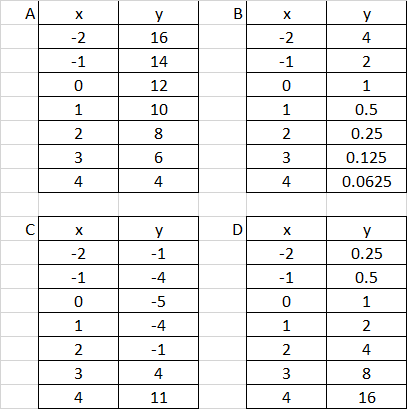
Q.Which table of data has a constant rate of change?
6
30 sec
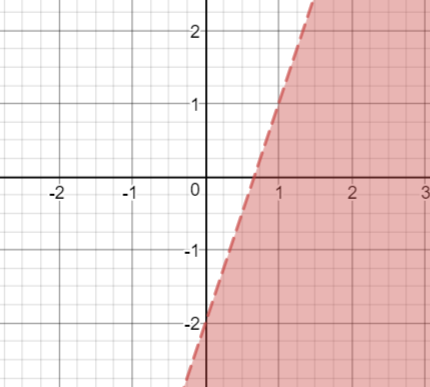
Q.What is the inequality that represents the shaded area of the graph?
7
30 sec
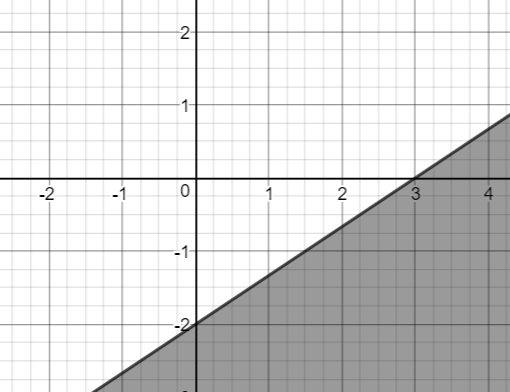
Q.What is the inequality that represents the graph?
8
30 sec
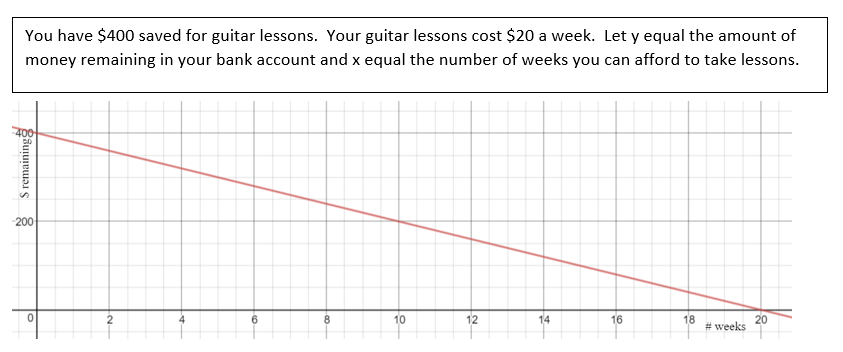
Q.Part 1: What function represents the amount of money you have remaining in your account each week.
9
30 sec
Q.Part 2: What is the average rate of change of the function? What does it mean in the context of the problem.
10
30 sec
Q.Part 3: What is the x-intercept and what does it mean in context of the problem?
11
30 sec
Q.Part 4: What does the y-intercept mean in the context of the problem.
12
30 sec
Q.What is the correct domain and range in the context of this problem?
13
30 sec
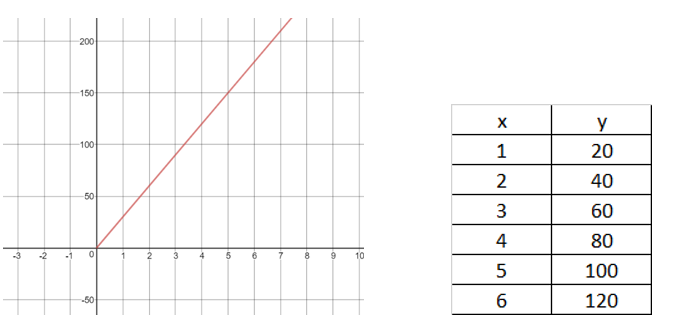
Q.Which function has the greater rate of change?
14
30 sec
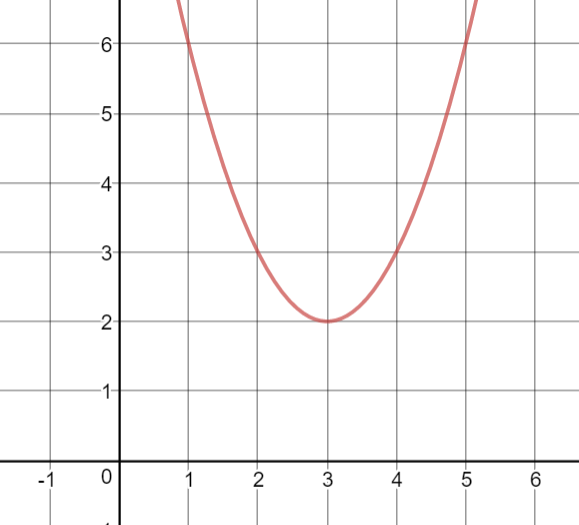
Q.What is the average rate of change of the graph on the interval x = 1 and 3?
15
30 sec
Q.Find the equation for the line that goes through (3, 1) and (6, 7).
16
30 sec
Q.The sales history for the last 7 years for a company is shown in the table. Using your calculator perform a linear regression to find a line of best fit for the data. Which function represents the best line of fit?
17
30 sec
Q.In the previous problem, you came up with a line of best fit. What does the coefficient of x represent in the scenario.
18
30 sec