Tip
Tap
a student's name
below to see what they need help with
Chapter Three Review
Quiz by Lexi Johnson
Feel free to use or edit the questions
includes Teacher and Student dashboards
Measure skills
from any curriculum
Tag the questions with any skills you have. Your dashboard will track each student's mastery of each skill.


20 questions
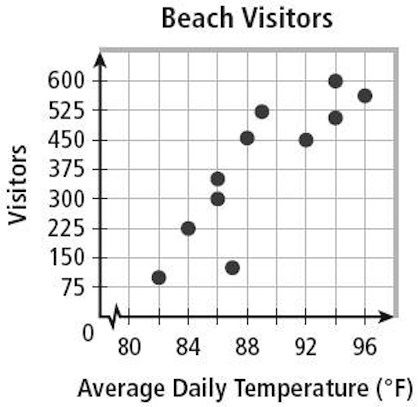
Q.What type of graph is this?
1
60 sec
Q.What is the variable for correlation?
2
60 sec
Q.What is the response variable?
3
60 sec
Q.Which most accurately describes the form of the graph?
4
60 sec
Q.What most likely would be the correlation?
5
60 sec
Q.If the correlation between height(feet) and weight(lbs) is .4, what is the correlation if height is in inches?
6
30 sec
Q.What is the y-intercept in this equation? Predicted value of dinner= 5.97 + 19(salary)
7
60 sec
Q.Explain in context the y-intercept: Predicted value of dinner= 5.97 + 19(salary)
8
30 sec
Q.What is the residual value if the predicted value was 40 and the actual is 28?
9
60 sec
Q.What point is on every LSRL(least squares regression line)?
10
30 sec
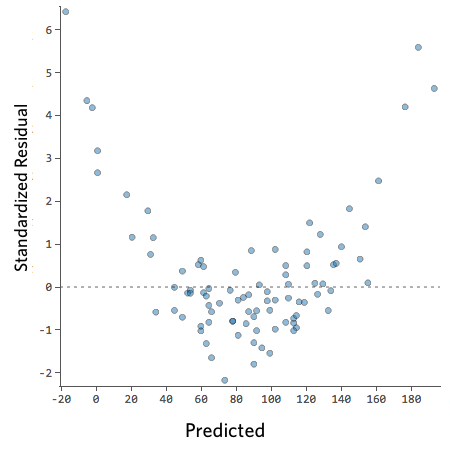
Q.Would a linear LSRL be a good fit for the scatterplot based on this residual plot graph?
11
60 sec
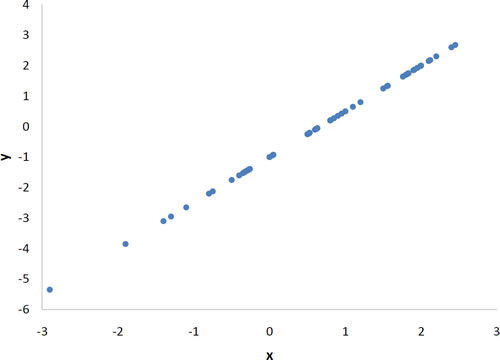
Q.Which graph has a stronger correlation?
12
30 sec
Q.What is the direction of the graph on the right?
13
60 sec
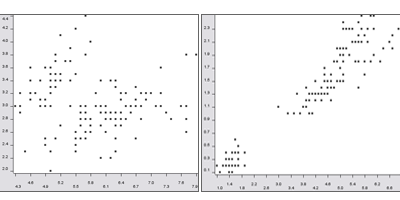
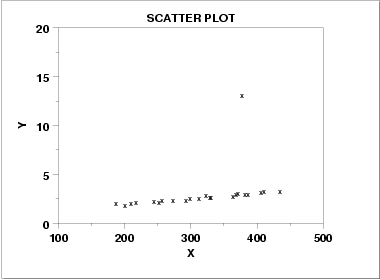
Q.Is the outlier an influential point?
14
30 sec
Q.What does the variable "s" represent?
15
60 sec
Q.What does the variable r^2 stand for?
16
30 sec
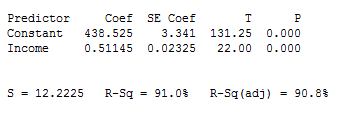
Q.What is the equation using the information from the minitab?
17
120 sec
Q.What is the correlation of the minitab?
18
120 sec
Q.What is the average prediction error?
19
120 sec
Q.How well does this information follow a linear line?
20
120 sec