Tip
Tap
a student's name
below to see what they need help with

NY State Testing Released Questions - Mathematics - Grade 7 (2018) - Topic: Statistics and Probability
Quiz by NY State Testing Released Questions - Mathematics - Grade 7 (2018)
Customize this quiz to suit your class
Instantly translate to 100+ languages
Measures 4 skills from
7.SP.C.7.B
Develop a probability model (which may not be uniform) by observing frequencies in data generated from a chance process.
7.SP.B.3
Informally assess the degree of visual overlap of two numerical data distributions with similar variabilities, measuring the difference between the centers by expressing it as a multiple of a measure of variability.
7.SP.C.6
Approximate the probability of a chance event by collecting data on the chance process that produces it and observing its long-run relative frequency, and predict the approximate relative frequency given the probability.
7.SP.C.5
Understand that the probability of a chance event is a number between 0 and 1 that expresses the likelihood of the event occurring. Larger numbers indicate greater likelihood. A probability near 0 indicates an unlikely event, a probability around 1/2 indicates an event that is neither unlikely nor likely, and a probability near 1 indicates a likely event.
Track each student's skills and progress in your Mastery dashboards
5 questions
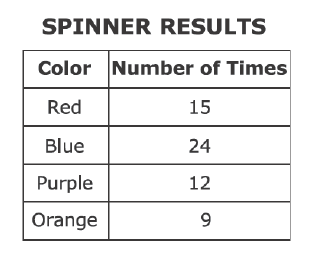
Q.A spinner is divided into four colored sections that are not of equal size: red, blue, purple, and orange. The arrow on the spinner is spun several times.
The arrow on the spinner will bespun one more time. Based on these results, what is the probability that the arrow will land on the purple section?
1
60 sec
7.SP.C.7.B
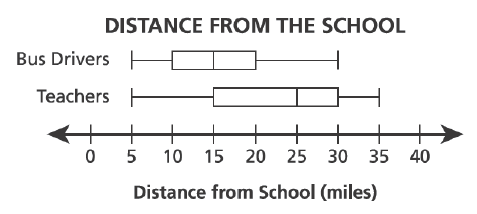
Q.A principal gathered data about the distance, in miles, that his teachers and bus drivers live from the school. The box plots below show these data.
Based on the box plots, which statement is true?
2
60 sec
7.SP.B.3
Q.A spinner with seven equal-sized sections was used to play a game.
• It was used 250 times in the first game.
• Of those 250, the arrow landed on section 7 a total of 35 times.
• The same spinner was used 150 times in the second game.
How many times did the spinner 'most likely' land on section 7 in the second game?
3
60 sec
7.SP.C.6
Q.A computer program selects blue, red, or green as the background color each time the program is used.
• The program was used 45 times on the same computer in one week.
• Of those 45 times, a blue background appeared 12 times and a red background appeared 21 times.
Based on this information, which statement about the likelihood of the green background appearing the next time the program is used is true?
4
60 sec
7.SP.C.7.B
Q.Which number represents the probability of an event that is very likely to occur?
5
60 sec
7.SP.C.5